Re-designed charting library built with React and D3.
React Integration
Easily integrate charts into React applications.
Customizable Components
Tailor charts to meet specific design needs.
Responsive Design
Charts automatically adjust to different screen sizes.
D3.js Compatibility
Leverage the power of D3 for advanced data visualization.
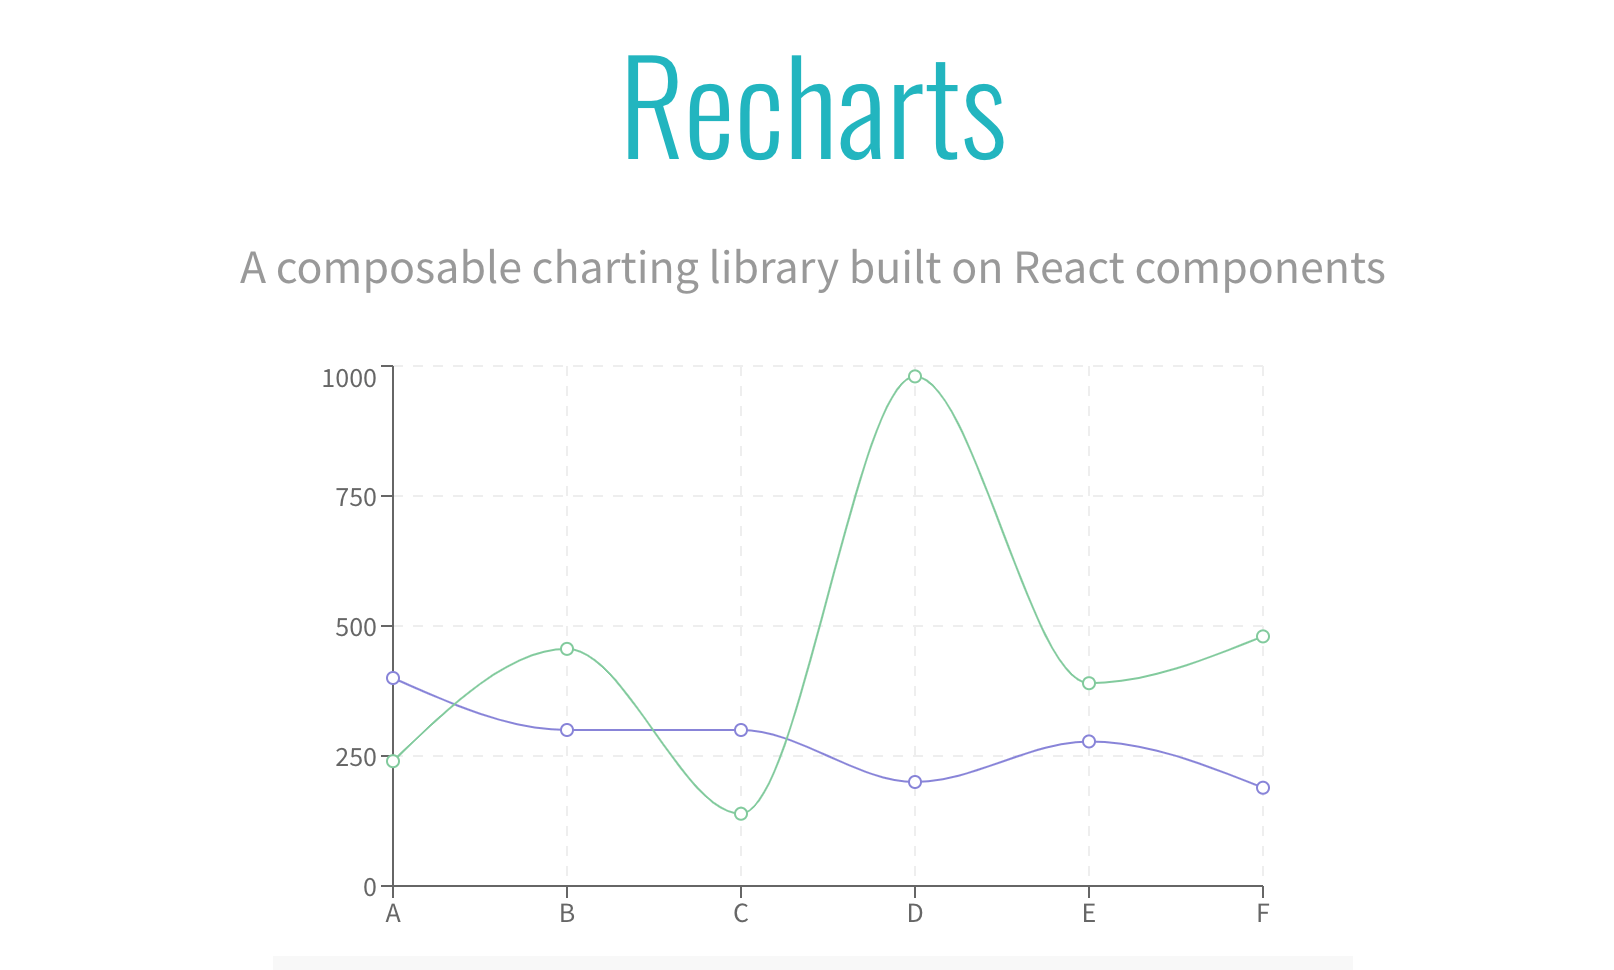
Recharts is a charting library that simplifies the process of creating responsive and interactive charts using React and D3.js. It allows developers to create a variety of chart types such as line, bar, and pie charts effortlessly. The library is designed with a focus on simplicity and ease of use, making it a popular choice among developers who want to incorporate data visualization into their applications without the complexity of traditional charting libraries.
Recharts is built on top of D3 and utilizes SVG elements for rendering charts, ensuring high-quality visuals. It supports a wide range of chart types and provides a set of customizable components to enhance user experience.
Building dashboards for business analytics
Visualizing data trends in web applications
Creating interactive reports for data presentation
You can create line charts, bar charts, pie charts, area charts, and more.
Yes, Recharts handles large datasets efficiently, leveraging D3.js for performance.
Absolutely! Recharts offers extensive customization options for styling and functionality.